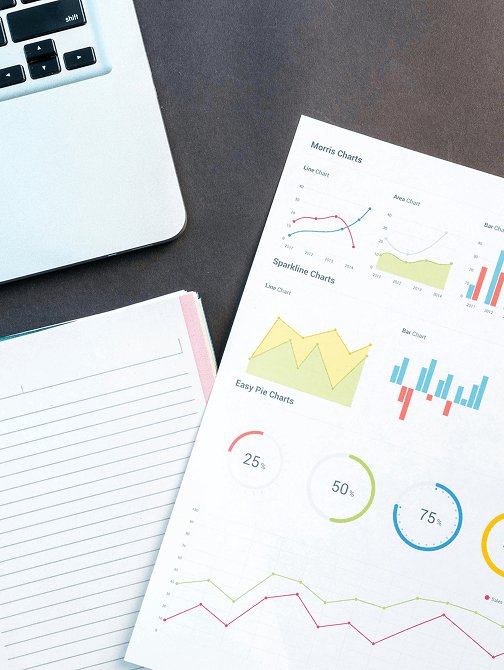
Why is Data Visualization So Important?
We explore why data visualization is so important for the contemporary workplace, from the standpoints of science, business, and logistics.
Most popular
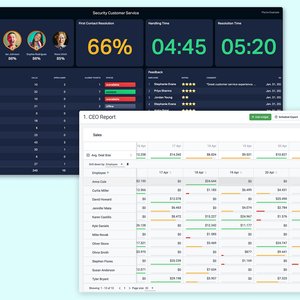
Dashboards vs. Reports: Key Differences Explained
Dashboards and reports are two crucial features for understanding your business data. Learn here about their differences and similarities, and how to leverage both for maximal effect!

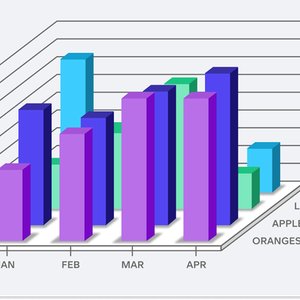
5 Examples of the Best Data Visualizations
Explore five of the best contemporary data visualizations that showcase creativity, innovation, and scientific clarity.
6 Examples of Bad Data Visualizations
We break down six examples of poor-quality data visualizations, looking at what makes them bad and how they can be improved for clearer, more effective data storytelling.

Five Things to Consider Before You Start Using Dashboards
You may think that designing an engaging and performance-boosting dashboard sounds like hard work. It's actually a lot easier than you think! In this blog post, we have gathered s…